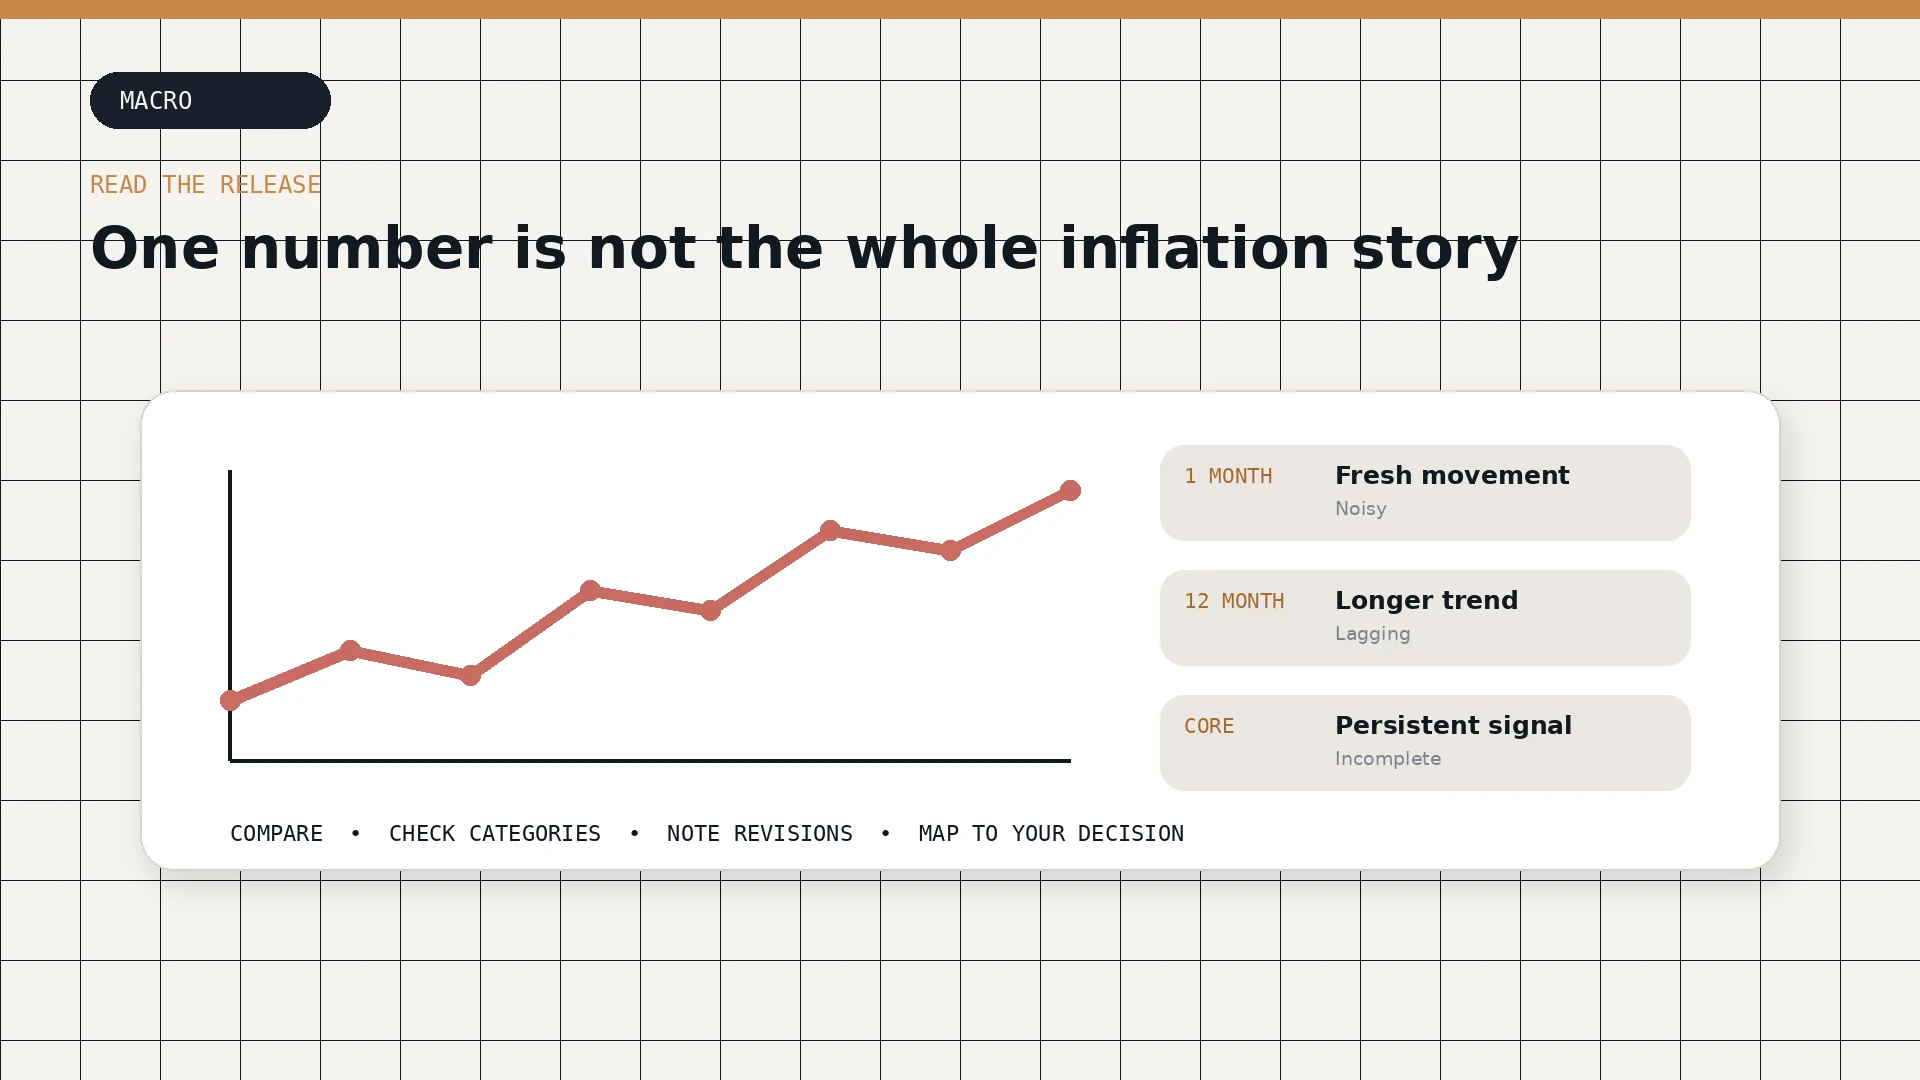
To read inflation data, identify the index and time period first, compare monthly and annual changes, then inspect headline, core, and category detail. A lower inflation rate usually means prices are rising more slowly—not that earlier price increases have reversed. Finally, check whether the change affects a number in your own budget or plan.
After identifying the trend that matters, use the Federal Reserve rate-change guide to trace how policy and market rates may reach cash, debt, housing, and portfolios.
Inflation measures how prices change, not whether the current price level feels affordable. This distinction explains why an inflation rate can fall while groceries, rent, insurance, or services remain much more expensive than several years earlier.
A release becomes useful when you read it as a set of measurements rather than one headline number.
Which inflation number are you reading?
| Measure | Question it answers | Common mistake |
|---|---|---|
| One-month change | How much did this index move since last month? | Treating one month as a forecast |
| 12-month change | How much did it move since the same month last year? | Reading it as the next year’s inflation |
| Headline versus core | Is movement broad or driven by excluded categories? | Assuming core represents every household bill |
| Index level | How have prices accumulated relative to the index base? | Confusing a slower increase with falling prices |
Use the same index, adjustment, and period for a comparison. The BLS CPI overview explains what CPI measures; the BEA PCE overview explains its broader expenditure measure. This guide concerns U.S. releases; other countries’ definitions and core measures can differ.
Pass 1: monthly inflation and seasonal adjustment
The monthly change provides the freshest information. It is also sensitive to volatile categories, seasonal adjustment, timing, and unusual events. One month can signal a change, but it rarely proves a durable trend.
When comparing monthly changes, confirm whether the figures are seasonally adjusted and whether you are looking at a percentage change or an index level. Avoid annualizing one unusual month and treating it as a forecast.
Pass 2: annual inflation and base effects
The year-over-year rate compares the current index with the same month a year earlier. It smooths some monthly noise but changes partly because an old month drops out of the comparison. This “base effect” can move the rate even when the current month is ordinary.
Use the 12-month measure to describe recent history, not the next 12 months.
Pass 3: headline and core
Headline inflation includes the complete published basket. Core measures commonly exclude food and energy to examine more persistent movement. Food and energy still matter to households; exclusion is an analytical technique, not a claim that those expenses are unimportant.
Look at both:
- Headline shows what happened to the full basket.
- Core can reveal broader persistence after volatile categories are removed.
- Category detail shows whether the movement is concentrated or widespread.
Pass 4: CPI vs. PCE inflation
The Consumer Price Index and Personal Consumption Expenditures price indexes differ in scope, weights, data, and formula. CPI measures prices associated with a consumer basket using BLS methods. PCE reflects consumer expenditures in the national accounts and allows weights to adjust differently as spending patterns change.
The Federal Reserve often discusses PCE inflation in its policy framework, while CPI is widely used in contracts, benefits, and public discussion. Do not subtract one from the other and call the difference an error. Understand which question each index answers.
What decision are you trying to make with inflation data?
Use your actual category changes and renewal quotes, not the aggregate index alone.
Review PCE, CPI, core measures, labor data, and the Federal Reserve’s stated outlook.
Use a range and stress test rather than extrapolating the latest month.
Use the relevant index, period, contract language, taxes, and total compensation.
Pass 5: category drivers and weights
A large percentage change in a small category may contribute less to the total than a modest change in housing or another heavily weighted category. Read the contribution and relative importance when available.
Separate:
- Goods from services
- Shelter from market rent quotes
- New and used vehicles
- Energy commodities from utility services
- Food at home from food away from home
- Medical prices from personal out-of-pocket spending
The index methodology may not match the timing of your own bills. Insurance, rent, tuition, or property taxes can reset annually even when the monthly index changes gradually.
Why can inflation fall while prices stay high?
Suppose a basket rises from 100 to 120 and then inflation slows. The basket can remain near 120 while the rate of increase declines. Affordability depends on income, taxes, debt, required spending, and the level of prices—not only the latest inflation rate.
For household planning, calculate category-specific changes from actual statements. The Budget Planner can show which categories drive your own monthly change. That personal measure is not a replacement for CPI or PCE; it is a decision aid. Follow the household budget guide to separate required bills from flexible spending before changing your plan.
Avoid the most common interpretation errors
| Scenario | Best for | Upside | Main trade-off | Next step |
|---|---|---|---|---|
| One hot month | Early warning | Shows fresh movement quickly | Can be noise or a volatile category | Wait for category detail and subsequent releases |
| Lower 12-month rate | Describing disinflation | Shows a broader slowing trend | Prices can still be high and rising | Separate rate from price level |
| Core differs from headline | Studying persistence | Highlights broad underlying pressure | Excludes costs households still pay | Use both and inspect drivers |
| Personal bills rise faster | Household budgeting | Reveals exposure to specific categories | Not representative of the whole economy | Adjust the budget without claiming the official index is wrong |
Revisions and release discipline
Economic data may be revised or supplemented. Record the release date and use the latest official table when making a serious decision. A social-media screenshot may mix monthly, annualized, seasonally adjusted, and unadjusted figures.
Create a simple release note:
- CPI monthly and 12-month
- Core CPI monthly and 12-month
- PCE monthly and 12-month
- Core PCE monthly and 12-month
- Largest category contributions
- What changed from the prior release
- What remains uncertain
Then decide whether the information changes a real household assumption. Most releases should update context, not trigger immediate transactions.
Turn the page into action
Read the next inflation release
- Confirm the index, period, seasonal adjustment, and units.
- Compare one-month and 12-month changes.
- Review headline, core, and major category drivers.
- Distinguish inflation rate from the price level.
- Compare official data with your actual category costs.
- Change a plan only when the evidence affects a real assumption or contract.
Move from the release to a household decision
First decide whether the release changes a number you actually use: a category budget, wage comparison, savings target, debt assumption, or expected real return. If it does not, record the context and avoid a transaction. If it does, document the old assumption, the new range, and the decision threshold.
Use the Budget Planner to compare category-level spending instead of treating the national basket as your personal basket. Use the Investment and Savings Calculator to test a range of nominal returns, then compare the result with the real-return method disclosed on this page.
If the decision concerns pay, compare your raise with inflation using matched periods and a price-index ratio. The result tests gross purchasing power; the household budget still needs actual take-home income and expenses.
Evidence to action
Methods and evidence
Methods used
- Personal spending inflation
personal inflation = weighted sum of category price relatives − 1 - Real return
real return = (1 + nominal return) ÷ (1 + inflation rate) − 1
Related data series
- U.S. Consumer Price IndexCataloged; automatic updating is not active yet.
- U.S. PCE price indexCataloged; automatic updating is not active yet.
- Federal Reserve policy rateCataloged; automatic updating is not active yet.
Next actions
Structured datasources.jsonformulas.jsonsystems.json
Evidence
Sources
- Consumer Price Index
bls-cpiU.S. Bureau of Labor StatisticsAccessedAugust 18, 2026
- Consumer Price Index Overview
bls-cpi-overviewU.S. Bureau of Labor StatisticsAccessedAugust 18, 2026
- Personal Consumption Expenditures Price Index
bea-pce-price-indexU.S. Bureau of Economic AnalysisAccessedAugust 18, 2026
- Economy at a Glance — Policy Rate
federal-reserve-policy-rateBoard of Governors of the Federal Reserve SystemAccessedAugust 18, 2026
Common questions
Frequently asked questions
Why can inflation slow while prices still feel high?
Inflation is the rate of change in prices. A slower rate means the price level is rising more slowly; it does not generally mean that prior increases reverse.
What is the difference between CPI and PCE inflation?
The indexes use different scopes, weights, formulas, and data sources. CPI is produced by the Bureau of Labor Statistics and PCE by the Bureau of Economic Analysis. They can tell different but complementary stories.
Should I focus on headline or core inflation?
Headline measures reflect the complete basket and matter to household budgets. Core measures remove selected volatile categories to help study persistence. Neither should be read alone.